Dataiku is a platform that systematizes the use of data and AI, bringing people together to produce incredible business results. Discover, share, and reuse code and apps across projects and teams to produce high-quality projects more quickly and shorten the road to production. Dataiku enables teams to develop and distribute data and sophisticated analytics at scale using cutting-edge approaches. Operations like data preparation, visualization, machine learning, DataOps, MLOps and building analytic applications could be performed in Dataiku. This article will guide you through these operations. Following are the steps that we are going to take for this demonstration.
Steps to be used
- Upload data to the database
- Data preparation
- Training ML model
- Deploy the ML model
Before jumping to the Dataiku platform, let’s understand what we want to do on the Dataiku platform. In this article, we will be building a regression model for the prediction of sales using Walmart data. The regression model will predict the weekly sale of the stores.
Upload data to the database
Once registered and logged in, would be redirected to a page. This page is a session page for the dashboard, where the session could be turned on/off. It takes 2-3 mins to start/end the session.
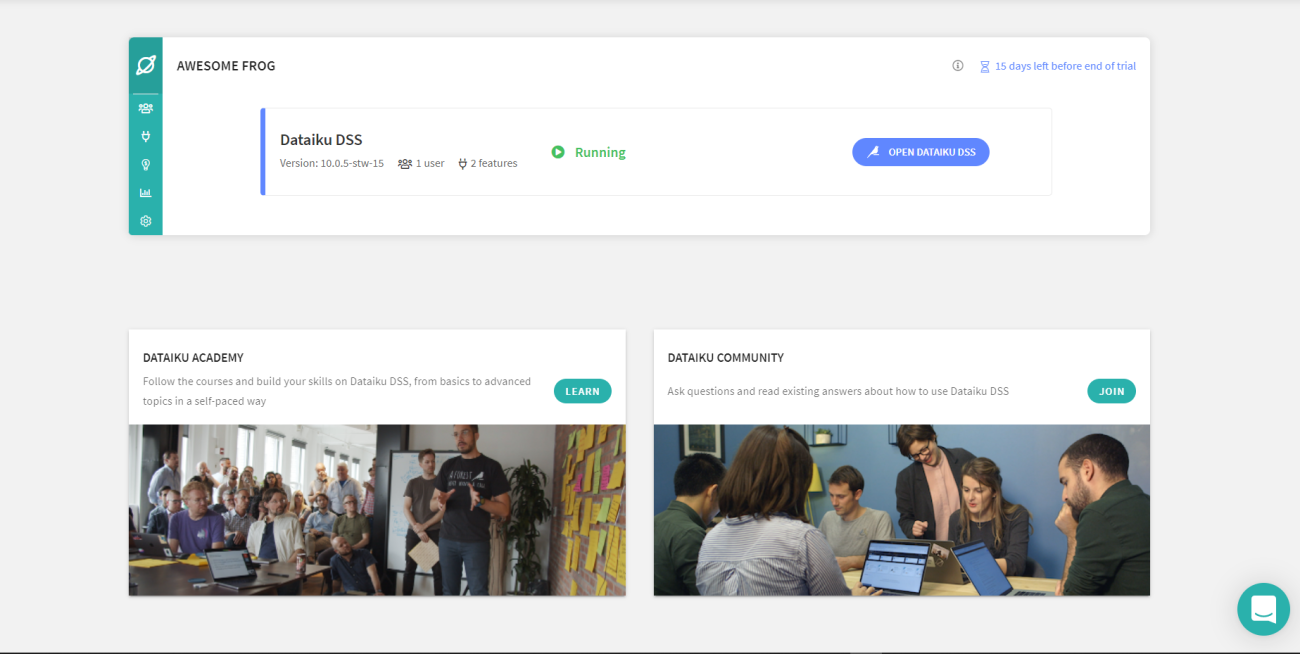
By clicking on the “Open Dashboard” button, opens a page where you need to name the dashboard and then can start the data uploading process.
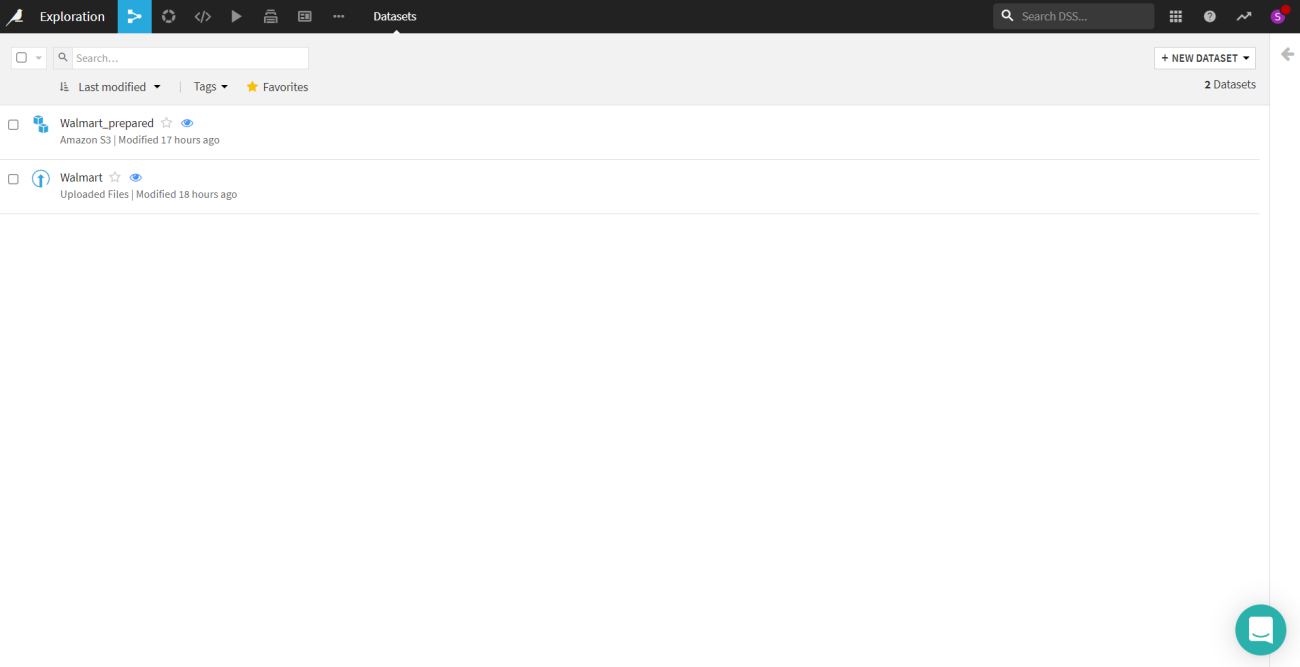
By clicking on the new dataset, one can upload the data. There are a whole lot of options to upload a dataset like uploading a data file, connecting to a network, cloud storage, etc. If you are uploading the data file there are both options to use the data offline and online. The offline is local which means it is limited to the project itself and the online it could be connected to an RDBMS and could be used in any project.
Here a Walmart sales data has been uploaded which will be used for this article. As in the snap above there is another data named “walmart_prepared” which is processed data.
Let’s see the processing process.
Are you looking for a complete repository of Python libraries used in data science, check out here.
Data preparation
After uploading the dataset you can now perform all the operations. The dataset dashboard would look something like this image.

On the right side of the panel, certain options are all the operations that would be performed on the dataset. Dataiku calls them recipes, there are visual recipes, code recipes and other recipes. In the “LAB” section we can perform the ML operations.
Visual recipes
This includes operations related to the dataset. All the database related operations like joining tables, synchronizing the data with other data, creating windows, sorting, etc. We could also perform the data wrangling.
Code recipes
You can write the python codes as well as SQL queries here either by just creating a notebook or a script. There is another option if you want to use a python API like Pyspark.
Once clicked on the prepare icon in the Visual recipes section. A screen would pop up which requires the name for the dataset after the preparation, where it needed to be stored and the format. After that, you would go to a page as shown below.
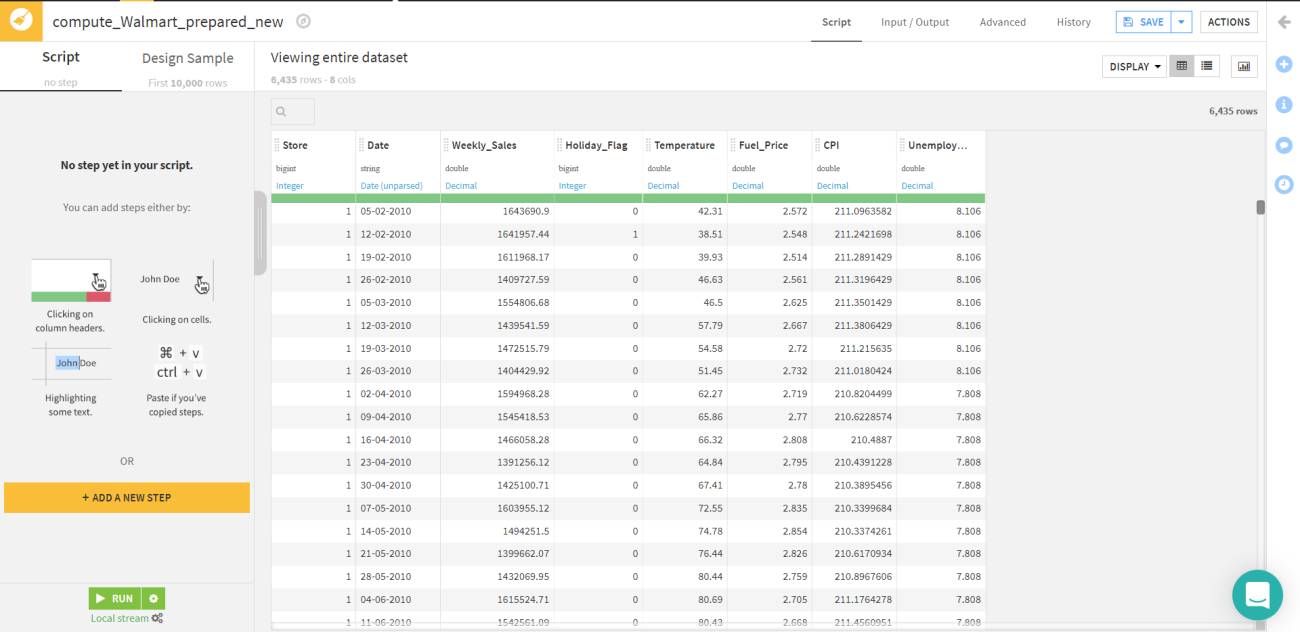
Click on “ADD A NEW STEP” and there would be a whole lot of options like filter data, clear null values, fill null values, join, etc. These operations could be performed on a single, multiple and all rows and columns depending on the need of the project.
For this article, we will perform the data cleaning in which we will clear all the null values. It could be done by clicking the checkbox of data cleaning and in the image below we could see that there are 11 operations offered by Dataiku in data cleaning. We would select the “ Remove rows where the cell is empty” process.

So we are ready to train the machine learning models.
Training ML model
To train a model, you must first access the “Lab”. Once you click the Lab icon from the Actions sidebar there would be model options such as AutoML, deep learning prediction, AutoML clustering, etc selected according to the need.
For this article, we have a regression problem of predicting the weekly sales. So, we would go with the AutoML prediction model. After selecting the model you need to define the target column. So in this article, the target column is “Weekly_Sales”.
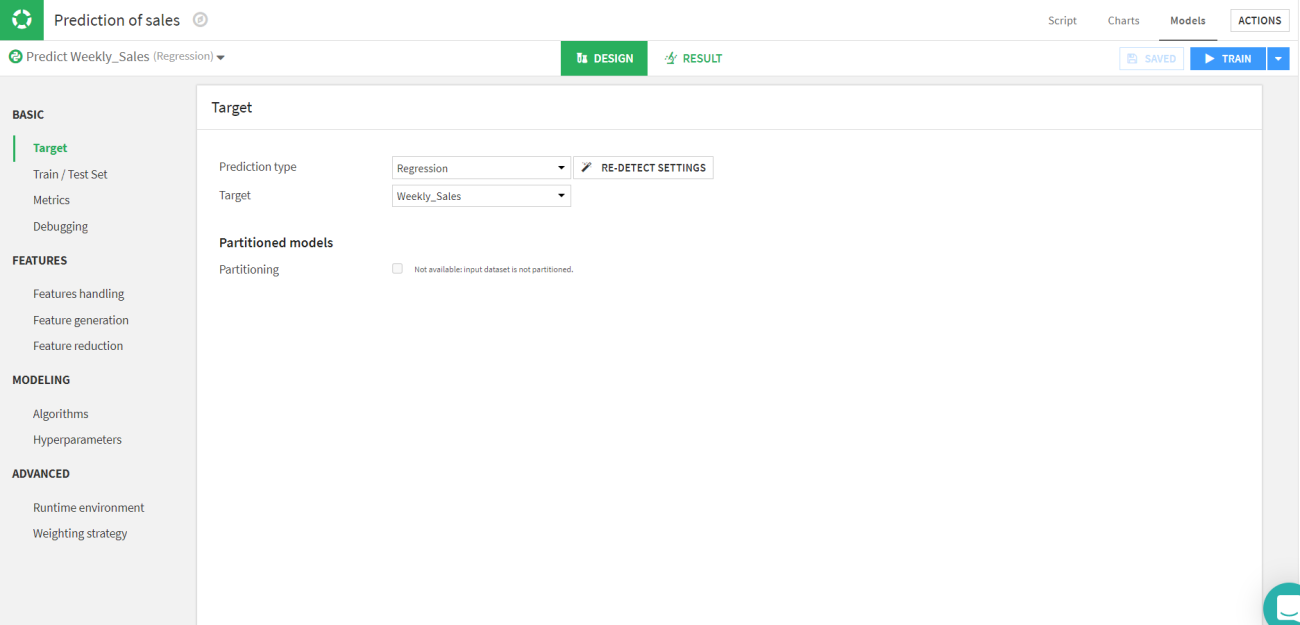
Let’s move to the next part which is splitting the train and test sets and selecting the evaluation metrics. We will be splitting the data into standard 70:30 ratio of train and test respectively. Since it is a regression model we will be using the RMSE and R2 scores as evaluation parameters for the test.
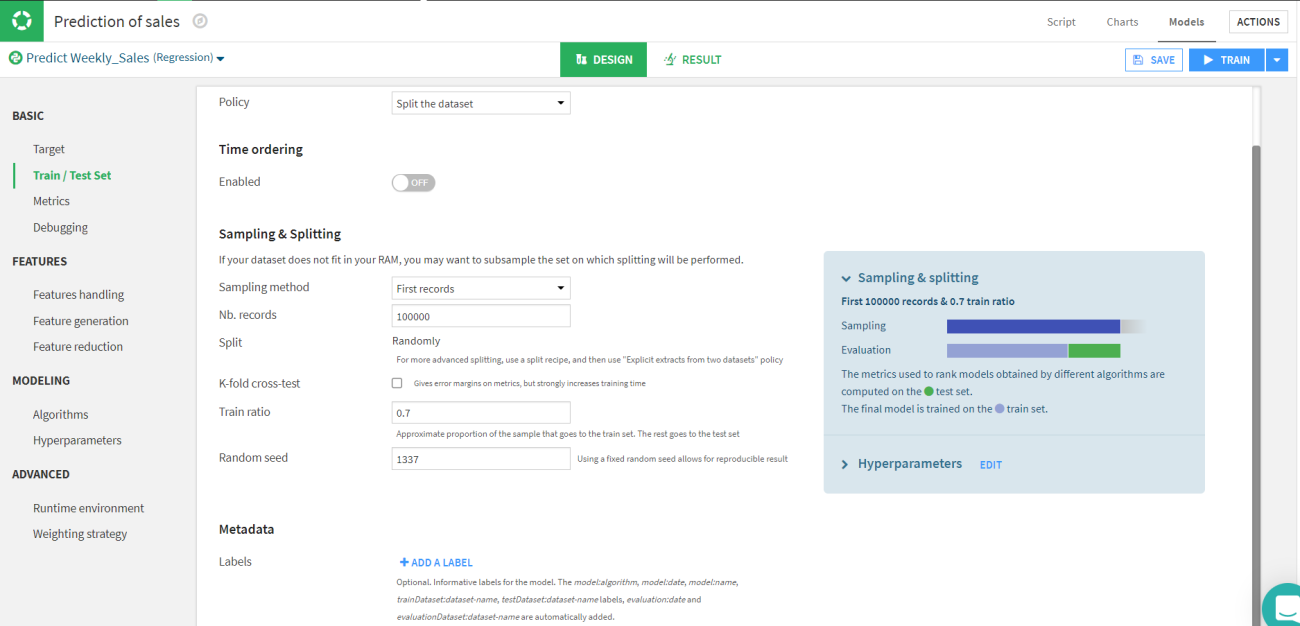
Now the basic data related part is completed. Let’s move to the modelling part where we need to select the algorithm and the hyperparameters for the model. We can also add custom models and train them.

We can train multiple models simultaneously. In this article, we will select random forest, lasso regression, ridge regression, SVM and XGBoost.
Once you are done selecting just click on the train button in the top right corner. Save the session and descriptions of the session.

Here in the above image, we can observe that the random forest is the best option for the data. We can also view the predicted data.
Inspect the model
Let’s have a look at the data predicted by the Random forest. If you click on the Random forest model in the session tab or the model tab you will be able to see a page like this.
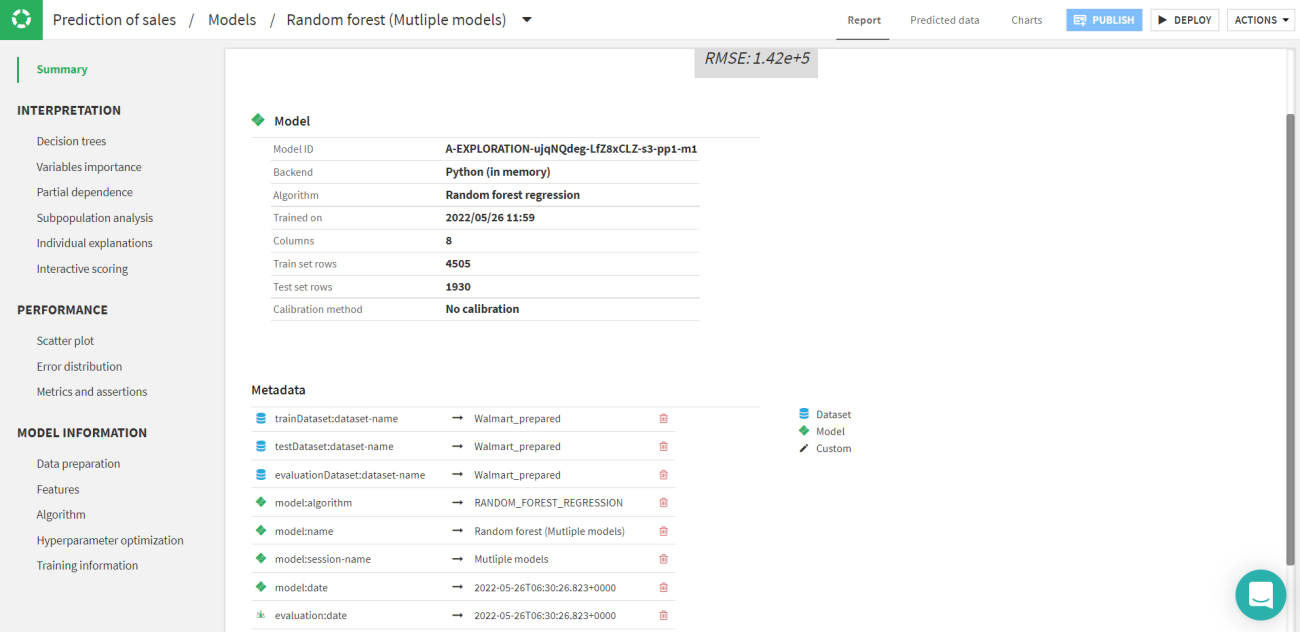
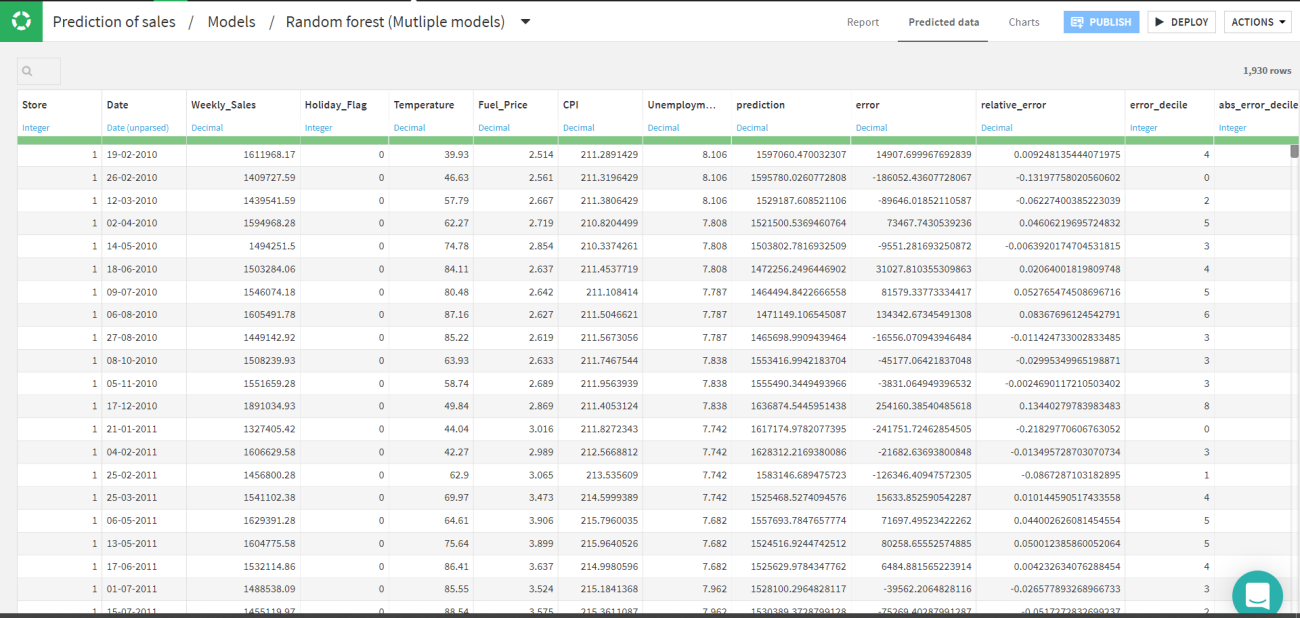
By clicking on the predicted data tab the predicted value with the other error rates could be viewed. These values are joined with the original data frame.
You can also see the regression plot for every model. As in this article, we are talking about Random forest as a final model. Let’s have a look at the regression plot.

Similarly, you can explore the decision tree from the random forest and tune the model accordingly. Also one can see the feature’s dependency on the model which is how a particular feature is affecting the model.
Deploy the ML model
Once you are satisfied with the performance of the model, it could be deployed for production usage. Just by clicking on the “Deploy” icon on the top right corner of the page. There would be a pop up asking about the model and the dataset to be used for the deployment.
Now you can go to the flow of the project and select the deployed model and to validate the deployed you can add a dataset.


Here is the pop-up and now you can give the input data for the validation of the model.

The job will start, and the execution time depends on the dataset. The number of columns to show in the output could be modified with a couple of other modifications also available.
The output data will be added to the flow of the project and you can access the data from there itself.
You can perform different actions to the predicted data like visualization, utilize that data for another model, etc.
Final words
Dataiku DSS (Data Science Studio) is a single solution that tackles the whole process of planning, delivering, and running a Data project. Dataiku DSS may be deployed in public clouds and coupled with a variety of cloud service providers. Dataiku DSS links natively to the whole spectrum of technologies within a data environment and maximizes their potential. With this article, we have built an end-to-end machine learning project on Dataiku.


