|
Listen to this story
|
Data-driven solutions have become an integral part of firms across industries as they strive to improve decision-making or automate processes. Subsequently, the number of vendors providing analytics has increased considerably in India over the last couple of years. Choosing the right data science service provider is one of the most crucial decisions enterprises make.
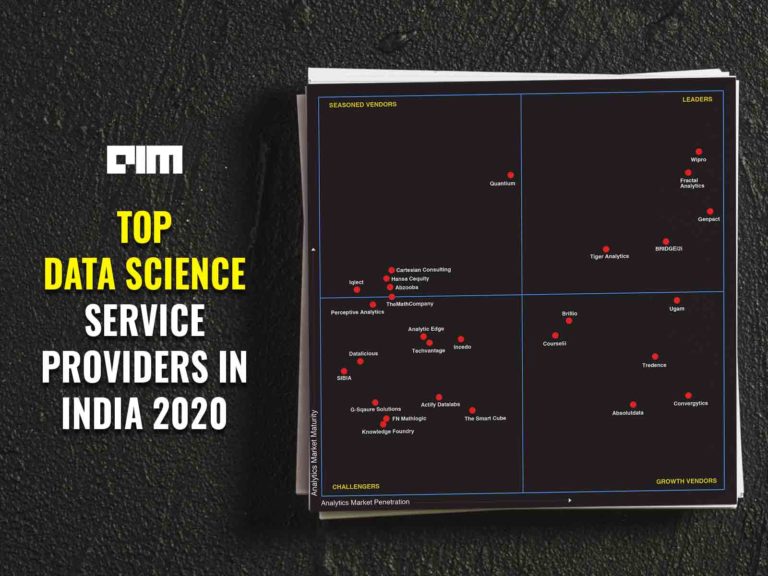
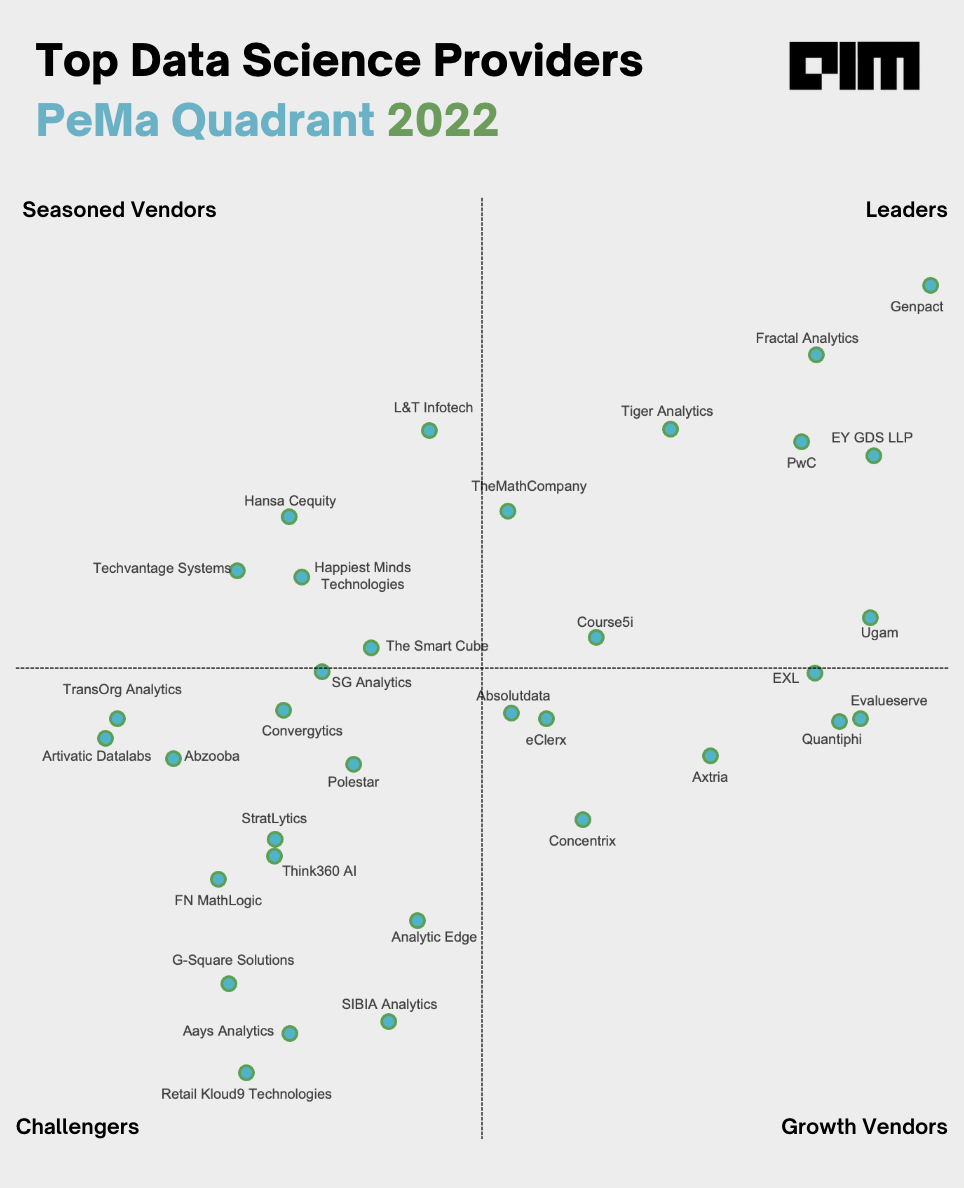
To assist enterprises in making this decision, Analytics India Magazine (AIM) has come up with the Penetration and Maturity (PeMa) Quadrant — an industry benchmark of vendor capabilities. AIM measures key parameters of leading service providers in terms of Penetration (Pe) and Maturity (Ma) and plots the relative positions of the firms in the Quadrant.
A balance between both these parameters is essential to respond to a client’s business challenges and seize revenue opportunities. The PeMa Quadrant, thus, helps enterprises get a complete overview of the capabilities and consider how they are stacked against each other.
The use of graphical representations to highlight vendor capabilities using a uniform, impartial, and third-party assessment of data science firms can help enterprises quickly ascertain their potential and the suitability for their needs.
It is important to note that vendors in the higher quadrants are not always the best course of action when deciding on hiring analytics or data science services. Small vendors with a niche customer base can sometimes make a better case to help achieve the company’s long-term goals.
You can read the PeMa reports from previous years here:
Scope & Methodology
The 2022 PeMa study results from extensive primary and secondary research across the market. The primary research details were collected by circulating a survey form across the companies.
The questions in the survey were curated by conducting preliminary research to identify what aspects define the Penetration and Maturity of a Data Science vendor the best. First, vendors were scored for each question in the survey form using uniform evaluation criteria based on their answers—outliers were capped. These scores were then normalised between 0 to 1. Finally, the average of these normalised scores made the sub-index scores, and the average of the sub-indices made the Penetration and Maturity index of the respective vendors.
This year 41 data science service providers participated in the study, of which 33 made it to the quadrant. No fee was charged for participation in the survey, and the participation was voluntary. The questions were answered by the companies using a Google Form. We reached back to nominees in case of discrepancies or clarifications required.
The vendors not mentioned in the report either did not participate in the study or did not meet the minimum criteria to be scored and plotted on the PeMa quadrant.
No fee was involved in terms of participation. At Analytics India Magazine, we do not make any paid lists.
The hierarchy used to calculate these sub-indices (using the answers to the survey questions) and then to calculate the Penetration and Maturity can be seen in the chart below.

Top Data Science Providers In India — PeMa Quadrant 2022
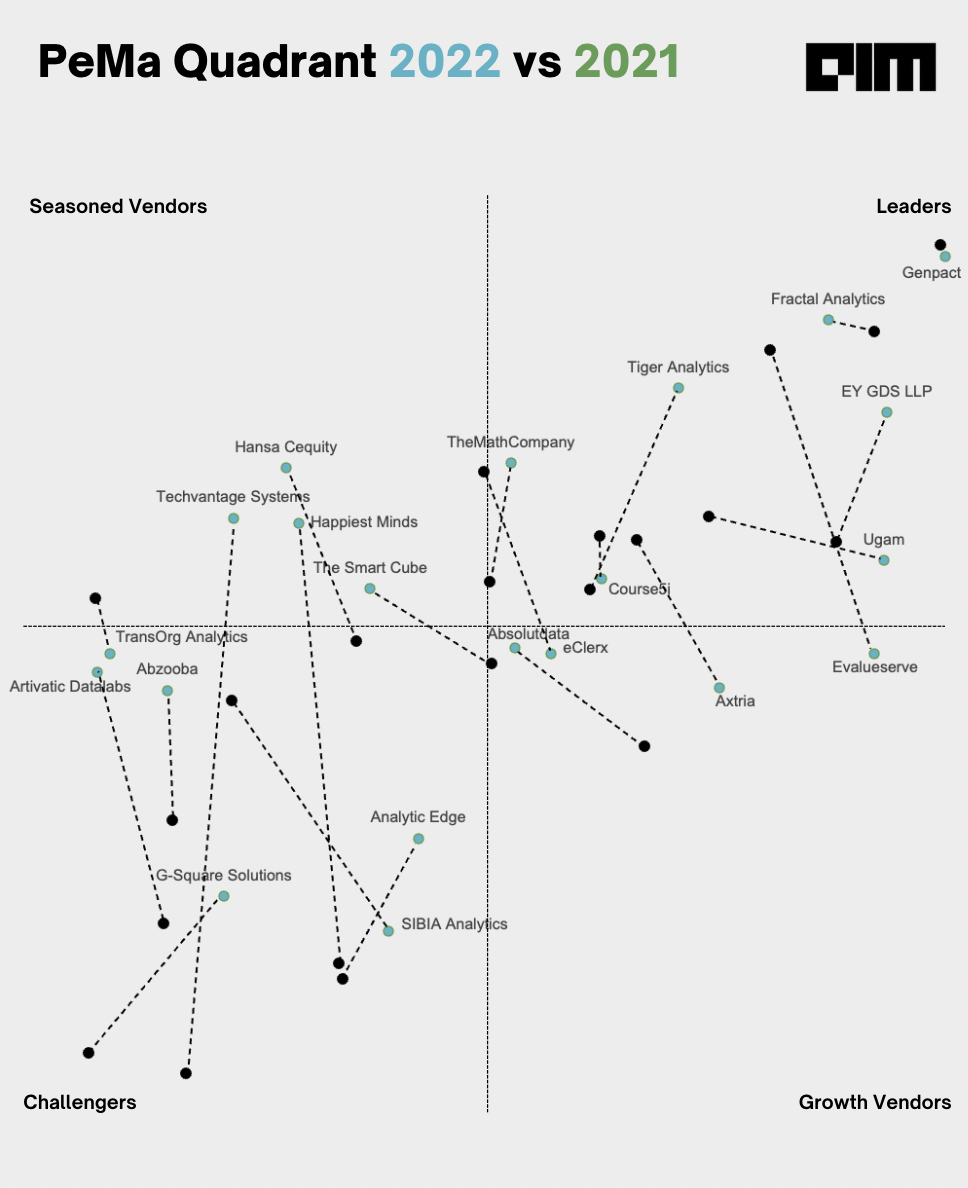
Comparing PeMa 2022 With PeMa 2021
Penetration
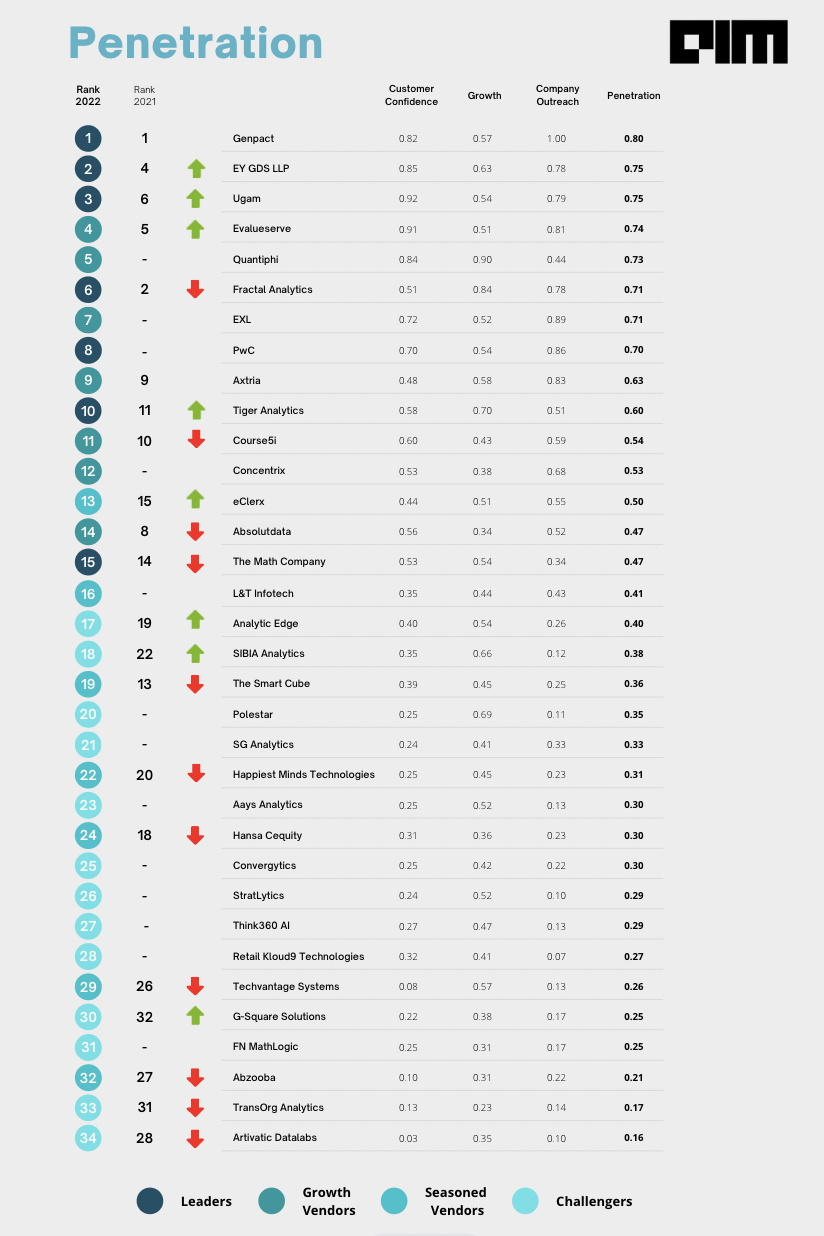
The Penetration index in the Quadrant evaluates the headway a vendor has made in the market compared to its competitors. This can help enterprises get a broader view of the vendor’s customers, the confidence it has instilled in them, and its growth in recent years.
The average penetration value of all the data science providers—calculated as the average of sub-indices Growth, Company Outreach, and Customer Confidence—is 0.45. Genpact scores the highest at 0.80, followed by EY Global Deliver Services and Ugam, both with a score of 0.75.
The average Penetration score of vendors in the Leaders Quadrant is 0.68, and in the Growth Quadrant is 0.62. This reduces to 0.34 for Seasoned Vendors and 0.29 for Challengers.
There is a moderately strong correlation between a company’s Penetration index and the company’s age. For example, companies founded before 2000 have an average Penetration of 0.65. The ones founded between 2000 and 2009 have an average Penetration score of 0.49, and the ones founded after 2010 score an average of 0.36.
Considering this, Quantiphi (for a company founded in just 2013) has a significantly high penetration at 0.73, followed by Tiger Analytics (founded in 2011) at 0.60. Tiger Analytics also scores well on Maturity (0.64), making it to the Leader’s Quadrant.
The companies with their headquarters in India have an average Penetration score of 0.35, compared to those that have established their headquarters outside at 0.54.
Growth
The Growth sub-index considers the percentage growth of a company over the last financial year and the estimated CAGR of the company in the coming five years. It also considers clients added over the last year and its competitors in the market.
Quantiphi (0.90) and Fractal Analytics (0.84) have the highest score in the sub-index, followed by Tiger Analytics (0.70), Polestar Solutions (0.69), and SIBIA Analytics (0.66).
Boutique firms offering pure-play analytics services are scaling fast and show significant growth compared to overall average growth of data science providers.
Bigger organisations offering pure-play analytics services saw significant growth in terms of their analytics team sizes last year. For example, organisations like TheMathCompany, Course5 Intelligence, SG Analytics, Tiger Analytics, Axtria, Quantiphi, and Fractal Analytics saw an average growth of 76%, compared to the overall average of 60%.
The top five companies (Quantiphi, Fractal Analytics, Tiger Analytics, Polestar, and SIBIA Analytics) who score the highest in the Growth sub-index have, on average, increased their teams by a third in the last financial year.
The top five companies that expect the highest CAGR in the next five years are, on average, predicted to double yearly. This includes eClerx, TransOrg Analytics, SIBIA Analytics, Polestar, and Aays Analytics. Apart from eClerx, these are relatively smaller organisations with an overall parent company size of less than 1000.
The top 10 companies with the highest number of new clients in FY-2021-22 have added more than 30 new clients. The top three companies have added more than 100 clients showing a significant hold in the market and a strong portfolio that enables them to hunt for new customers.
All the top companies with the highest growth sub-index estimate the lowest competition in the analytics markets. Not all of these are necessarily niche AI/data science providers. Some big companies command such a significant market share that they do not consider smaller players a competition despite their innovative technology offerings.
Customer Outreach
This sub-index considers the data science providers’ clients across different geographies, the total number of offices across the globe, the period they have been offering data science services, and the size of their data science unit. All of these metrics define, in different ways, a company’s power in terms of client outreach.
While big ITeS companies Genpact, Evalueserve, and Concentrix or consultancy firms like EY and PwC (that have been serving analytics services for decades) have a high presence across multiple geographies, boutique analytics firms Axtria, Analytic Edge, Axtria, and Course5i are also offering their services to clients across almost all geographies of the world.
An organisation’s score for client outreach is significantly correlated to its score on the total number of offices across the globe, suggesting that (despite the world going digital) a physical presence is of the utmost importance to improve market penetration.
An organisation’s score for client outreach is significantly correlated to its score on the total number of offices across the globe. The top ten companies with the highest number of offices globally have an average score of 0.89 in the parameter. The same ten companies have an average score of 0.83 in the parameter that calculates the score for clients it serves across geographies. This suggests that, despite the world going digital, a physical presence is of the utmost importance to improve market penetration.
Companies with the highest number of offices have an average of five to six offices in India in cities including Bangalore, Delhi, Mumbai, Chennai, and even some tier II cities. Along with this, they have offices in multiple locations across the globe, including North America, Europe, and Southeast Asia.
Genpact has been providing analytics or data science services for the longest period of time and scores the highest on penetration. Overall, the period for which organisations have been providing analytics services is heavily correlated (correlation of 0.82) with Company Outreach. However, Quantiphi and L&T Infotech have been offering analytics services for less than 10 years and perform relatively well in the sub-index. They score 0.44 and 0.43, respectively. This puts Quantiphi in the Growth Vendors Quadrant and the L&T just short of the Leaders quadrant (in the Seasoned Vendors Quadrant).
Of all the Data Science providers that participated, the biggest analytics function has more than 11,000 data science employees, while some have just half a dozen employees. Almost all of the organisations in the top ten are IT/ITes companies or are big consultancy firms. Their existing ecosystems or technological capabilities have enabled them to scale fast and grow their analytics functions. All of these top 10 companies have more than 2000 employees and make it to the Leaders or Growth Vendors Quadrant.
Customer Confidence
This sub-index calculates Customer Confidence based on the total number of clients, the Fortune 500 clients, and the percentage of the company’s business that comes from repeat clients.
All the companies in the Leaders quadrant have an average number of 226 clients. This average is 192 for Growth Vendors, 59 for Seasoned vendors, and 30 for Challengers. Seven of the ten companies with the highest number of clients have their headquarters outside India. Many of these companies also have offices almost all across the globe, and all of these companies have been offering analytics services for an average of 18 years.
Vendors in the Leaders Quadrant also have the highest number of Fortune 500 clients at an average of 101, followed by the Growth Vendors (59), Seasoned Vendors (14), and Challengers (7). Data science providers with the highest number of clients also have a higher share of clients from the Fortune 500 list. For instance, on average, more than two in five (45%) clients of Leader vendors are from the Fortune 500 list. This share lowers to 31% for Growth vendors, followed by Challengers at and Seasoned Vendors at 23%.
Data science providers with the highest number of clients also have a higher share of clients from the Fortune 500 list.
Repeat customers are very important for a company’s sustainable growth since the cost price of winning that revenue is lesser. A higher percentage of business coming from repeat customers is also indicative of the confidence level customers have in you as a brand. This is especially true when it comes to bigger vendors. Some ITeS companies like Genpact, EXL, and Evalueserve, which have a big number of clients, have a significant portion of their analytics business coming from repeat customers. This number is relatively low for Consultancy Firms.
Overall, Leaders have an average of 64% of their analytics business coming from repeat clients. It is highest for the Growth Vendors at 78%. Challengers have a relatively smaller number of clients. Considering this, the percentage of clients giving repeat business is 69%, while for Seasoned Vendors it is 57%.
Maturity

The Maturity index identifies a vendor’s progress in terms of the work it delivers. This can help customers decide which firms are positioned to help enterprises in the long haul. The index in the Quadrant evaluates the technical maturity of the organisations based on three factors, the projects they work on, their employee maturity, and the support offered to their analytics functions.
The average maturity value of all the data science providers—calculated as the average of sub-indices Work Delivery, Employee Maturity, and Support Function—is 0.51. Genpact again scores the highest at 0.71, followed by Fractal Analytics at 0.68. Tiger Analytics and L&T both score 0.64 to come third and fourth.
The average Maturity score of vendors in the Leaders Quadrant is 0.64, and in the Seasoned Vendors Quadrant, it is 0.56. Growth Vendors and Challengers score an average of 0.50 and 0.43.
Unlike Penetration, a company’s Maturity index is not correlated with the company’s age or size. The companies with their headquarters in India have an average Maturity score of 0.50, very similar to those with their headquarters outside at 0.52, indicating that the headquarter also does not impact the firm’s maturity.
Work Delivery
The Work Delivery sub-index measures the capabilities of an organisation in terms of the technology, its best projects, and its client portfolio.
While all analytics roles have an important role to play and bring significant value, advanced analytics capabilities enable data science providers to deliver complex solutions. We calculated the advanced analytics offered by these firms as a percentage of the total analytics.
Seasoned Vendors have more share of their analytics professionals working on advanced analytics than the Growth Vendors or Leaders. An average share of 71% of the total analytics functions of the Seasoned vendors works in advanced analytics. This share is 68% for the Leaders and 67% for Growth vendors. It lowers down to 57% for Challengers.
Smaller players offering niche data science/AI solutions tend to have more maturity in their domains and are often chosen depending on the need or the problem statement.
While the share of analytics professionals working in Leader organisations might be lower, Leaders still have high technical abilities. They can produce end-to-end scalable projects because of the availability of the right and ample resources. These companies have worked on some of the most complex projects using state-of-the-art techniques and technologies. The top projects built by these firms were scored out of ten using uniform evaluation criteria. Leaders score an average of 7.8, followed by Seasoned Vendors at 6.3. Growth vendors and Challengers both score 6.2.
The sub-index also quantifies the array of clients these companies are offering their services to. If most of their analytics function works for just one client, then this is indicative of a limited client portfolio. Data Science providers in the Challengers quadrant have an average of 23% of their analytics function working for just one client. This percentage is only 7% and 9% for Leaders and Growth Vendors. Seasoned Vendors have an average of 15% of their analytics professionals working for just one client.
Employee Maturity
The maturity of your analytics talent and balanced team composition, combined with healthy work policies, enables your firm, in a lot of ways, to build complex and state-of-the-art solutions. In this sub-index, we take a holistic overview of the data science providers’ employee maturity and how they enable the teams in terms of work delivery.
The median employee experience is moderately correlated with the age of the company. Older the company, higher is the median. Leaders and Growth Vendors both have a median employee experience of around 5.9 years. This is 4.9 and 4.7 years for Seasoned Vendors and Challengers. The top ten companies with the highest employee experience have an average of 8.0 years. Seven of these ten companies have their headquarters outside India.
The maturity of your analytics talent and balanced team composition, combined with healthy work policies, enables a firm, in different ways, to build complex and state-of-the-art solutions.
Similarly, the average median tenure of a Leaders employees is the highest at 3.9 years. This is followed by Seasoned Vendors at 3.1 years and Challengers at 2.9 years. It is lowest for Growth Vendors at 2.8 years. While Growth Vendors have been able to penetrate markets, they need to improve on their overall employee maturity to progress in terms of their technical capabilities and move to the Leaders Quadrant. The top ten companies with the highest employee median tenure have an average tenure of 4.6 years.
Along with a median employee tenure, the attrition rate is another good indicator of employee maturity. The ten companies with the lowest attrition rates among all the Data Science providers in this PeMa quadrant have an average attrition rate of 9%. Seasoned Vendors have the lowest average attrition rates among all the firms at 18%, while the Growth Vendors have the highest average attrition rate at 23%. Leaders have an attrition rate of 19%, while for Challengers, the numbers stand at 20%.
Support Function
While having a good talent is crucial, the talent should have the right support or resources to be able to function efficiently and grow. This sub-index analyses the Support Function made available by the data science providers for its analytics function. The sub-index considers the various partnerships they have made with product companies for their analytics professionals to use, along with its R&D and marketing budgets.
Some of the biggest firms, including the top pure-play analytics firms, the top ITeS companies, or the consulting firms, have the need and the necessary capital to make a variety of product partnerships that can cater to different roles within the analytics functions. The data science providers who score the highest in this parameter have made Cloud partnerships with AWS, GCP, and Azure. They have also made partnerships with companies offering statistical analysis or data visualisation tools like Power BI, Tableau, and Qlik, and other tech partnerships with companies like SAP, Uniphore, UiPath, etc.
Innovation is very crucial for a company to remain relevant, especially when it comes to the field of AI and Data Science. Smaller companies realise this very. They understand that innovation and finding a niche will keep them in the competition and will lead to clients choosing them over already established companies offering data science services. Hence, even smaller players also are able to win Fortune 500 clients. Challengers have an average R&D budget of 13%. This percentage is 8% for Seasoned Vendors. Bigger companies or Growth Vendors and Leaders invest an average of 7% of their revenue in R&D.
Smaller companies realise that it is innovation and finding a niche is what will keep them in the competition and lead to brands choosing them over already established data science companies.
Most tech companies have realised the impact marketing can have in terms of gaining visibility, especially to attract the best talent. And with talent crunch being one of the most pertinent issues the Indian data science industry faces, a healthy investment in talent branding or marketing is a must. Here again, Challengers invest the highest in terms of their revenue share.
On average, the data science providers in the Challenger quadrant invest 8% of their revenue in marketing. For Seasoned Vendor, this number is 6%. Leaders (3%) and Growth Vendors (4%) understandably have lower budgets considering their market penetration. Also, the revenues generated by these firms are bigger, bringing the share down. The absolute budgets are considerably higher.


